Analytics · Strategy
Churn prediction that sales teams actually use
How to build a churn model that changes behaviour: a clear definition, no leakage, calibrated scores, ranked lists with reasons and holdout-measured lift.
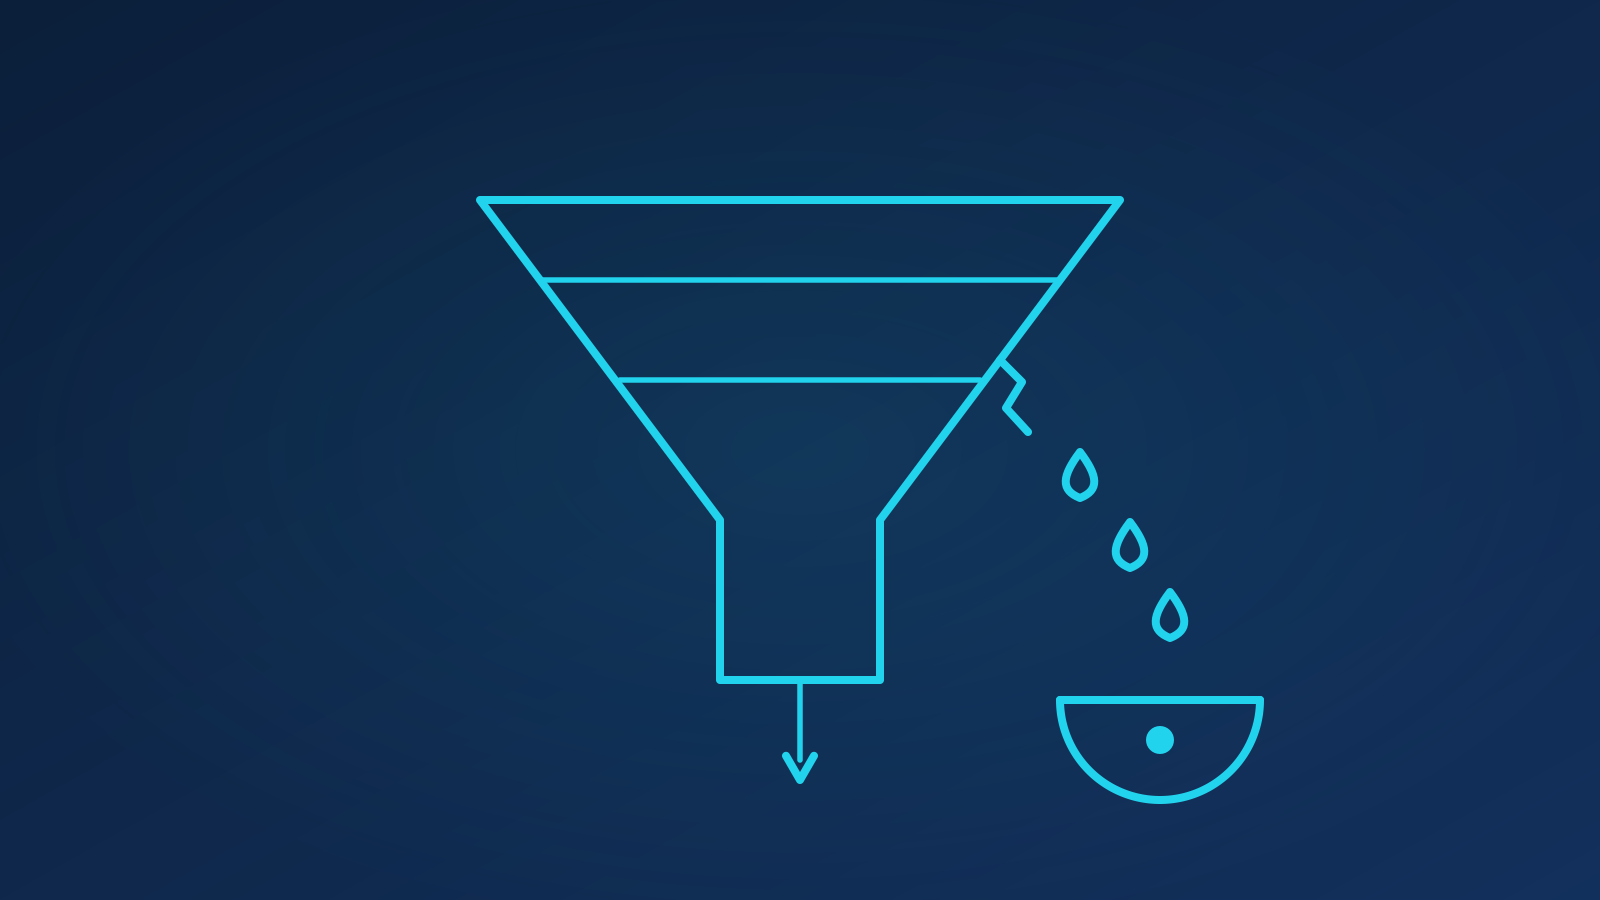
A churn model that sales teams use is one that puts a short, ranked list of at-risk accounts inside the CRM every week, with a plain-language reason for each and a suggested action, and that can prove with a holdout group that acting on the list saves revenue. The modelling is the smaller part. Most churn projects fail because churn was defined loosely, the model learned from information that will not exist at prediction time, or the output was a spreadsheet of probabilities that nobody opened.
TL;DR
- Define churn as an observable event with a fixed horizon before you build anything.
- Only use features that would have been available at the moment of prediction; leakage produces beautiful backtests and useless models.
- Prefer well-calibrated, explainable models over marginal accuracy gains.
- Deliver ranked lists with reasons and playbooks inside the CRM, not scores in a dashboard.
- Measure lift against a holdout that receives no intervention, and feed outcomes back into the model.
What exactly are you predicting, and over what horizon?
"Churn" needs an operational definition. For a subscription business it might be "does not renew within 30 days of contract end"; for a usage business, "no billable activity for 60 consecutive days"; for a retailer, "no purchase in the next 90 days after having purchased in the previous 90". Write it down, agree it with sales and finance, and be explicit about edge cases: downgrades, pauses, mergers, accounts that were never really active.
Then set the horizon and the cadence. Predicting churn "eventually" is easy and useless; predicting it in the next 60 days, scored weekly, gives a rep time to act. The horizon should be long enough for an intervention to work and short enough that the reasons are still current. Match the prediction unit to how the team sells: account, subscription or user.
Which features are available at prediction time, and where does leakage hide?
For every candidate feature ask one question: at the moment we run the model, would this value have been known exactly as it appears in the training data? Product usage trends, support ticket counts and sentiment, billing events, contract dates, engagement with the account manager, and changes in the customer's own business are the usual valuable signals. Build them as of the prediction date, from snapshots, not from today's tables.
Leakage is the silent killer of churn models. Common traps:
- Post-outcome fields: a "cancellation reason" or "status = churned" column that is only populated after the event.
- Backfilled tables: a CRM field that is updated retroactively, so the training snapshot contains knowledge from the future.
- Renewal-process artefacts: a drop in logins in the last week of a contract because the customer already decided.
- Target proxies: "days since last invoice" when churned accounts simply stop being invoiced.
The defence is a point-in-time feature store or, at minimum, disciplined snapshotting, and a validation split by time rather than by random rows. If a model looks suspiciously good on a time-based backtest, look for leakage before you celebrate.
Which model, and why calibration matters more than accuracy?
Gradient-boosted trees on tabular features remain the workhorse: strong on mixed data, robust to scaling, and explainable per prediction with contribution methods. Logistic regression is a respectable baseline and sometimes the final answer when the team values a model it can read. Deep learning rarely earns its complexity here unless you are modelling raw event sequences at scale.
What matters more than squeezing out another point of ranking accuracy is calibration: when the model says 30 percent, roughly 30 percent of those accounts should churn. Calibrated scores let you compute expected revenue at risk (probability multiplied by account value), set thresholds by capacity, and be honest with the team. Check calibration on the time-based holdout and correct it with isotonic or Platt scaling if needed. Also handle the class imbalance sensibly: churn is usually a small minority, so evaluate on precision at the top of the list and on lift, not on overall accuracy.
How do you turn scores into something a rep will act on?
A rep does not want a probability; they want to know who to call, why, and what to say. Deliver:
- A ranked list sized to capacity, say the top twenty accounts per rep by expected revenue at risk, refreshed weekly.
- Reasons in plain language, generated from the top feature contributions: "usage down 40 percent over 8 weeks; two unresolved support tickets; champion left the company".
- A suggested playbook keyed to the dominant reason: an executive check-in for a champion change, a training session for low adoption, a service review for support pain.
- A one-click outcome field: contacted, saved, lost, not a real risk.
Embed all of this in the CRM the team already works in, as a view, a task queue or a field on the account record, with the reasons visible where the rep is looking. A separate dashboard is where churn models go to die. This is straightforward integration work with the CRM's API and a scheduled scoring job, and it is the step most often skipped.
The most frequent pitfalls, and what fixes them:
| Pitfall | Symptom | Fix |
|---|---|---|
| Vague churn definition | Model and sales disagree on who churned | Written, dated definition agreed with finance |
| Leakage | Excellent backtest, no real-world lift | Point-in-time features, time-based validation |
| Uncalibrated scores | Reps stop trusting "90 percent" accounts that renew | Calibrate on holdout; report expected revenue at risk |
| Scores without reasons | List gets ignored | Per-account contributions translated into plain language |
| No holdout | Nobody can say whether it worked | Randomised control group with no intervention |
How do you know it is working?
Measure lift, not model metrics. Randomly hold out a share of at-risk accounts that receive no proactive outreach and compare their retention with those on the list who were contacted. The difference, multiplied by account value, is what the programme is worth. It also protects you from the common illusion in which the model flags accounts that would have been saved anyway.
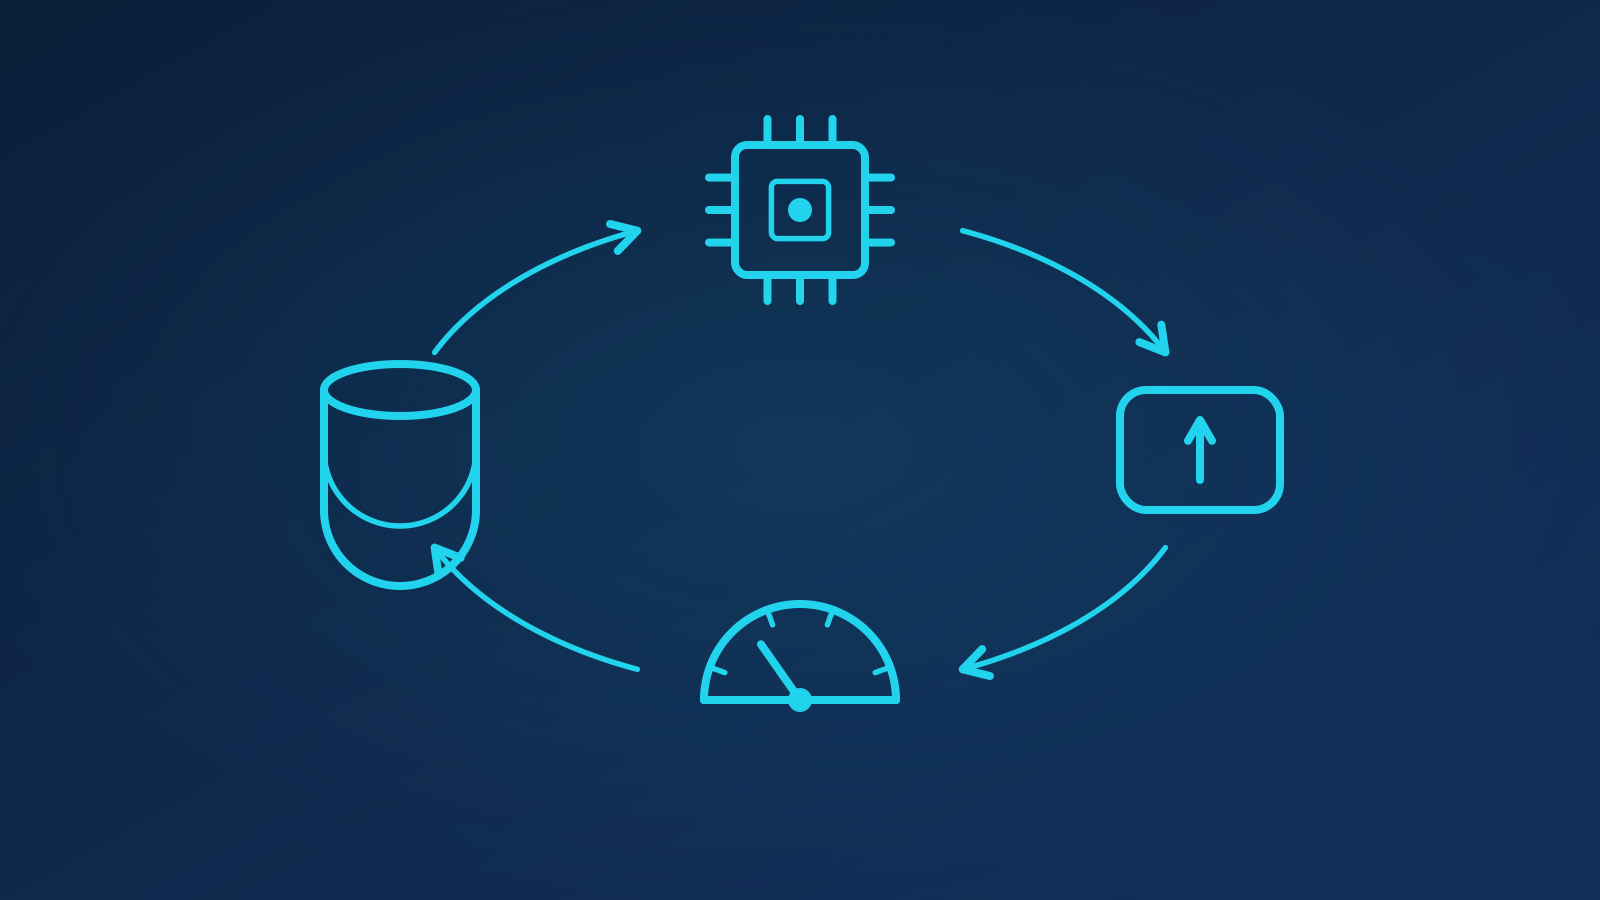
Close the loop. Every rep outcome ("not a real risk", "saved") is a label, and every save or loss is a fresh training example. Retrain on a schedule, monitor score drift and top-feature stability, and revisit the churn definition when the product or pricing changes. As an illustration, a team that starts with a modest holdout-measured improvement in retention among top-ranked accounts and iterates on the playbooks each quarter will typically see the gap widen as reps learn which reasons respond to which action.
This is the predictive analytics pattern we apply well beyond churn: expansion propensity, payment risk, lead scoring. If you have a churn problem and a CRM full of untapped signal, talk to us about a scoped first model.
Key takeaways
- Write down the churn event, horizon and unit before touching data.
- Build features as of the prediction date and validate by time; treat a too-good backtest as a warning.
- Choose calibrated, explainable models and evaluate on lift and precision at the top of the list.
- Ship ranked lists with reasons and playbooks inside the CRM, with a one-click outcome field.
- Prove value with a holdout group and feed every outcome back into the next model.
FAQ
How much historical data do we need before building a churn model?
Enough completed outcome windows to cover a few business cycles: for a 60-day horizon, a year of history usually gives several thousand account-periods, which is adequate for a tree-based model. What matters more than volume is that features can be reconstructed as they were at each prediction date. If your CRM overwrites history, start snapshotting now and use a simpler, rules-based risk list in the meantime.
Should the sales team see the raw probability?
Usually not on its own. Show expected revenue at risk and a rank, with the reasons, and keep the raw score available for those who want it. Probabilities invite arguments about individual accounts ("this one is fine, the model is wrong"), whereas a ranked, reasoned list invites action. Once scores are calibrated and the holdout shows lift, trust follows and the number becomes less contentious.
What if the model flags accounts we cannot do anything about?
That is useful information rather than a failure. Some churn is structural: a customer acquired, a business closed, a product retired. Add a "not actionable" outcome so reps can mark those, exclude the pattern from future lists, and report the addressable share of at-risk revenue separately. Over time the reasons and playbooks concentrate on the churn the team can genuinely influence.

Written by
Ali Waqas · Data Scientist
Owns data exploration, model development and evaluation, from forecasting and NLP to computer vision.
About the team →Related services

Ready to chart your AI course?
A free 30-minute consultation: we listen, ask hard questions and tell you honestly where AI will and won't help.